Video:
Overview:
An explosion in production of single-cell expression data has triggered the need for a search engine. CellAtlasSearch uses GPU computing and Big Data mining techniques to address this need in a scalable manner. Users can query with one or multiple single-cell expression profiles to retrieve the top matches from a large database of the single cell and bulk expression profiles along with relevant meta-information.

How to use:
Cell Atlas Search has a user-friendly interface. This page gives a step by step guide on how to use the search engine. Please go through the steps mentioned below to understand the procedure to be followed in order to find similar items to your query samples
Step-1
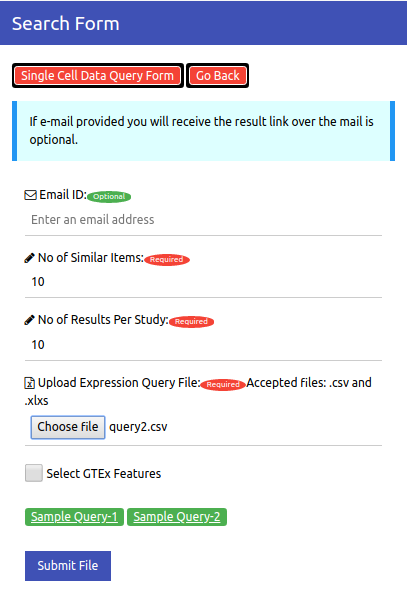
Select the dataset (single cell / bulk) you want to search against.

Step-2
Fill in the Email ID in the form where you wish to receive the result page URL (Optional).
Step-3
Enter the number of nearest neighbours to wish you to find for you query.
Step-4
Enter the maximum number of redundant occurrences you wish to see per the same experiment.

Step-5
Upload the query file. For query file guidelines, see 'Input File Preparation' Section.
Hit the SUBMIT Button.

Step-6
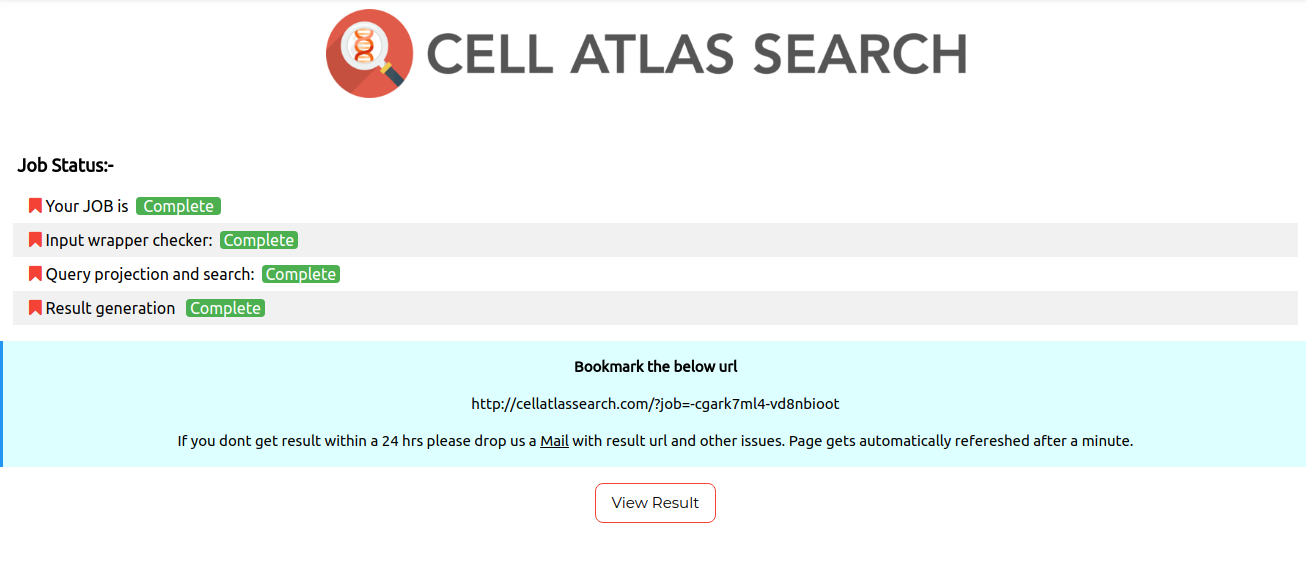
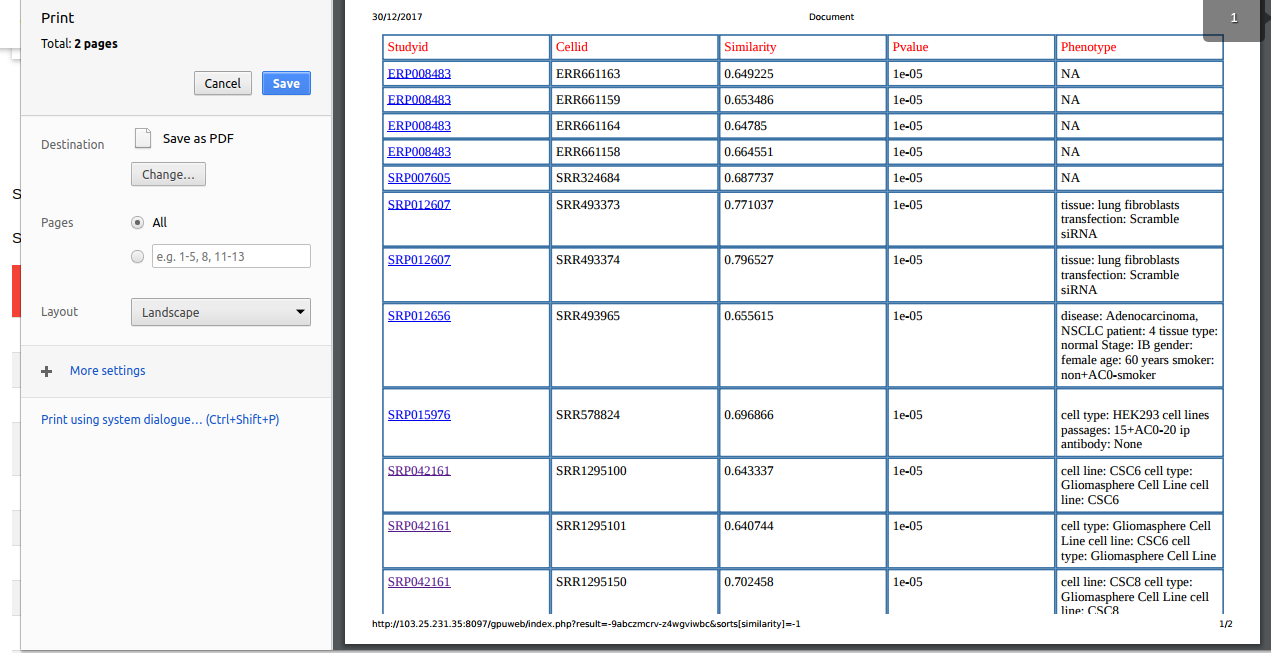
Once your query is completely processed, the job status page is displayed. Navigate to the result page by clicking on view results on job status page.You will see a page shown as shown below.


Input File Preparation :
File Format
Cell Atlas Search accepts query files in .xlsx and .csv formats.
File Description
Input file must contain gene counts data as a matrix. The first column must contain the corresponding gene symbols. The first row must contain sample labels. If the input is provided as a .xlsx file, the information must be present in the first sheet itself
A sample query file can be viewed here.
Genes Details
Cell Atlas Search is built on a set of 21159 genes. The list of genes used can be found here.
Users do not have to bother about maintaining the right set of genes in the query file. The query preprocessing step handles the user query intelligently to align the genes in a set order along with that it also handles cases when the number of genes is more or less. it is highly recommended to provide information of a maximum number of genes with high sequencing depth counts in order to get the best results.
For details about scenarious where users do not have information of all the genes used by the server, please visit the FAQs section.
Results
-
Cosine Similarity
Based on LSH, cosine similarity values are reported between top matching nearest cells and the query cells in the Similarity column.
-
P Value
For each query, we provide the nearest matching neighboring expression profiles with its cosine similarity value and a statistical significance in terms of p-value, which tells the chances of occurrence of the cosine similarity value for that cell type was purely by chance or not.
-
Study ID
For each cell in the result, this column gives the study or experiment to which it is belongs to. The value in this column links it to its SRA study page.
-
Discription
The discription data for the predicted closest cell is presented in the description column. This data was extracted from the GEO Database.
-
Interactive Summary
This is an D3.js insipired plugin which gives an interactive visualiztion of viewing frequent repeating discription. While hovering over the bubbles one can see the highest occuring discription in the result for the given query.
-
Heat Map
The heat-map is generated by taking the adjusted p-values of the top hits for each query cell. This union of top hits is listed on the x-axis, and the input cells are listed on the y axis to form a grid. Each element in the grid shows the intensity of 1+cosine values for the predicted hit for that input query cell.
-
Spectral TSNE Plot
Spectral TSNE plot plots the cosine expression matching matrix data on the first two principle components axes. This plot gives a first hand view of the nature of the input data.


Application:
Discovery of cell type for query single cell expression profiles
To avoid false discovery of rare cells, researchers may crosscheck their suspected rare cell transcriptomes for accidental availability of like expression profiles.
It offers a means for noise-free clustering of single cell expression data